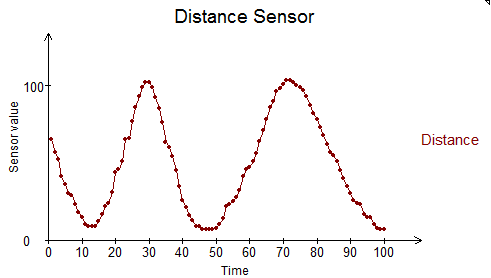
NXT Logo Examples: Online visualization of ultrasonic distance sensor data in chart
This example demonstrates how to immediately visualize distance measured by a robot in a chart in Imagine Logo. It is based on the nxt.imt library, i.e. it is not utilizing the NXT Logo interpreter, the NXT brick can be running any kind of program (with standard firmware).
First, load the nxt.imt and charts.imt libraries:
load "nxt.imt
load "charts.imt
Then, create a simple line chart object named s4:
new "LineChart [name s4 title [Distance Sensor] xlabel [Time] ylabel [Sensor value] legend [Distance] nseries 1]
Set the list of values to be empty:
make "sensor4 [[]]
Make the chart visualize the contents of variable sensor4:
s4'setdata ":sensor4
Connect to NXT (replace the port name with appropriate outgoing virtual serial port of your BlueTooth connection to NXT):
nxt_connect "com8
Setup ultrasonic sensor on port 4:
nxt_setinputmode PORT4 10 0
Fetch and display 100 sensor values in the chart. Keep moving the robot meanwhile:
repeat 100 [make "sensor4 (list fput nxt_readus PORT4 first :sensor4) s4'paint wait 20]
We may want to adjust the range of the y-axis:
s4'setymax 120
s4'paint
The result may look like this:
