Difference between revisions of "Spike Prime - Mathematical Pendulum"
m |
m |
||
| Line 1: | Line 1: | ||
== Let's begin == | == Let's begin == | ||
| − | + | Have you been to a museum of clocks? In Bratislava, we have one, remember to [https://www.visitbratislava.com/places/museum-of-clocks-house-at-the-good-shepherd/ stop by] at your next visit to Bratislava! :-) | |
| + | |||
| + | An extraordinary Dutch scientist and inventor Christiaan Huygens studied various topics in physics and astronomy, such as the theory of light waves. Part of his work focused on mathematical pendulum. He was the first to derive the formula for calculating the pendulum period based on other variables, such as its length. In 1656, Huygens constructed the first pendulum clock. For about 300 years, they were the most reliable machine to measure time precisely. | ||
| + | |||
| + | In this exercise, we will observe the behavior of a pendulum depending on various variables. | ||
| + | |||
== Build == | == Build == | ||
| Line 8: | Line 13: | ||
[[Image:spike_pendulum_model.png|model of pendulum|700px]] | [[Image:spike_pendulum_model.png|model of pendulum|700px]] | ||
| + | |||
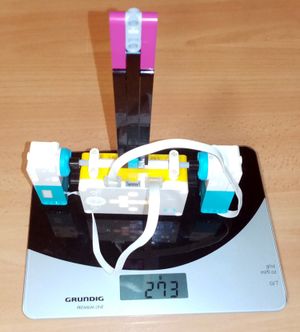
| + | The model contains some parts from the extension set such as the large wheels. They are not essential, you can use your creativity and use other parts to raise the bottom of the model and to balance it with a weight on the back, if you only have the basic Spike Prime set. | ||
| + | |||
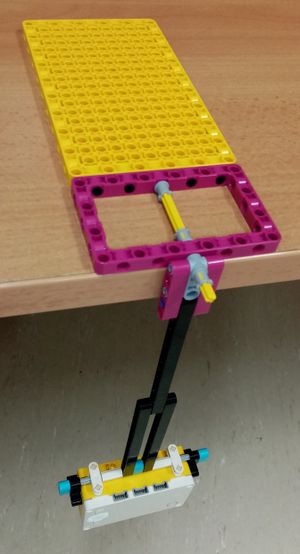
| + | Hint: if you do not have enough time to build this model, you can still perform the experiment: just attach the pendulum using a simple axle as shown in the last picture, it will work the same. | ||
Pictures: | Pictures: | ||
| Line 19: | Line 28: | ||
[[Image:spike_pendulum_7_weight_of_light.jpg|weight of light|300px]] | [[Image:spike_pendulum_7_weight_of_light.jpg|weight of light|300px]] | ||
[[Image:spike_pendulum_8_weight_of_heavy.jpg|weight of heavy|300px]] | [[Image:spike_pendulum_8_weight_of_heavy.jpg|weight of heavy|300px]] | ||
| + | [[Image:spike_pendulum_9_an_alternative_setup.jpg|an alternative setup|300px]] | ||
Building instructions: | Building instructions: | ||
| Line 39: | Line 49: | ||
Download: [[Media:pendulum.llsp|pendulum.llsp]] | Download: [[Media:pendulum.llsp|pendulum.llsp]] | ||
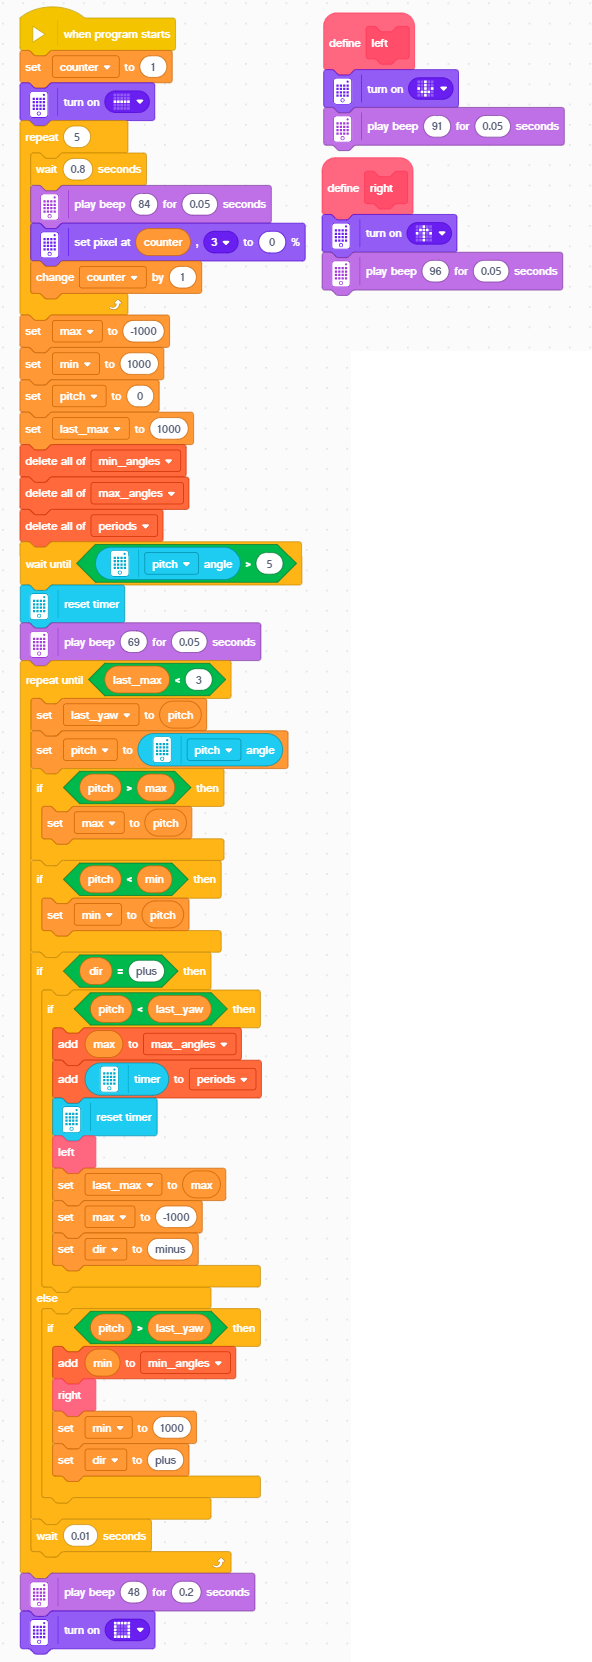
| − | + | The program gives the user a short time in the beginning to make sure that the pendulum is in a proper starting position. It visualizes this waiting stage on the display and with a sound. The pendulum should be started from the left side. The program then waits until it will swing to the right for the first time, and then it starts looking at the pitch value of the gyroscope, which oscillates between -90 and 90, and it is 0 when stopped and freely hanging. The program observes the changes of the pitch value and indicates the current direction of the swing on the display. At the same time, it is measuring the maximum angular displacement in both directions. It is also calculating the swing time of a complete cycle, a period. The maximum angular displacements and the periods are stored into the array so that they can later be processed on the computer - for instance visualized in a spreadsheet program. | |
| − | |||
| Line 47: | Line 56: | ||
<youtube width="450" height="800">22uleirJ8f0</youtube> | <youtube width="450" height="800">22uleirJ8f0</youtube> | ||
| − | + | Read the video description for details of our measurement! | |
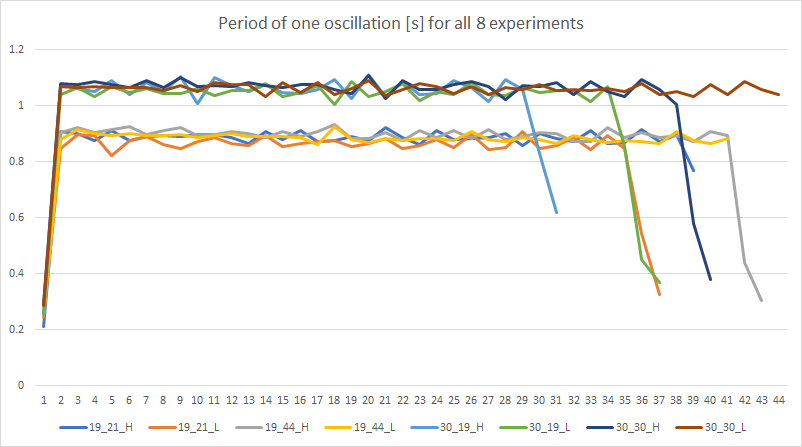
Example result of measurement (x: the number of oscillations, y: seconds (duration of 1 oscillation = period) in the first chart and maximum angle in degrees in each oscillation in the second chart) | Example result of measurement (x: the number of oscillations, y: seconds (duration of 1 oscillation = period) in the first chart and maximum angle in degrees in each oscillation in the second chart) | ||
| Line 56: | Line 65: | ||
Download: [[Media:spike_pendulum_experiment.zip|experiment.zip]] - recorded data from all 8 combinations as seen in video | Download: [[Media:spike_pendulum_experiment.zip|experiment.zip]] - recorded data from all 8 combinations as seen in video | ||
| − | * | + | * What can you see in the charts? |
| + | * How does changing of weight influences a) period, b) maximum angular displacement, and why? | ||
| + | * How does changing the starting angular displacement influences the period? | ||
| + | * How does changing the length of the pendulum influences and the period? | ||
| + | * Make your own measurements and recording. | ||
| + | * Experiment with other lengths, weights, starting positions. | ||
| + | * Extract the data from the measurements and create spreadsheet tables and charts. | ||
| + | * Discuss in your group what has happened. | ||
| − | + | How to export variables from your Spike Prime program? | |
<youtube>oIyN_EZNsQQ</youtube> | <youtube>oIyN_EZNsQQ</youtube> | ||
| + | |||
| + | Read the video description! | ||
| + | |||
== Explore and modify == | == Explore and modify == | ||
| − | * Modify the program so that ... | + | * Modify the program so that it will measure and record the angular velocity during the swing. Measure the velocity for different starting conditions (length, weight, starting angle). Visualize it. Discuss what has happened. |
* Modify the model so that ... | * Modify the model so that ... | ||
| Line 75: | Line 94: | ||
== Additional resources == | == Additional resources == | ||
| − | * Download: [http://robotika.sk/spike/ | + | * Download: [http://robotika.sk/spike/spike_physics_8_pendulum.zip Pendulum - all media files] |
__notoc__ | __notoc__ | ||
Revision as of 10:11, 23 February 2020
Let's begin
Have you been to a museum of clocks? In Bratislava, we have one, remember to stop by at your next visit to Bratislava! :-)
An extraordinary Dutch scientist and inventor Christiaan Huygens studied various topics in physics and astronomy, such as the theory of light waves. Part of his work focused on mathematical pendulum. He was the first to derive the formula for calculating the pendulum period based on other variables, such as its length. In 1656, Huygens constructed the first pendulum clock. For about 300 years, they were the most reliable machine to measure time precisely.
In this exercise, we will observe the behavior of a pendulum depending on various variables.
Build
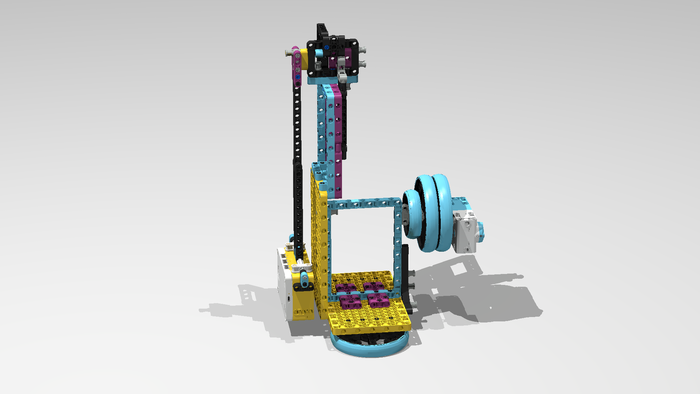
Model:
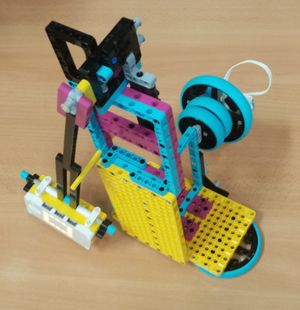
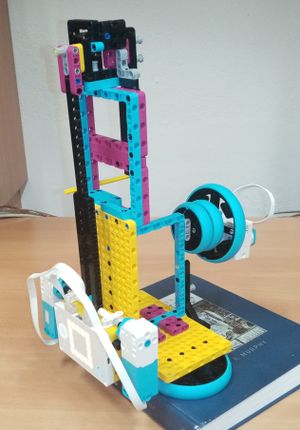
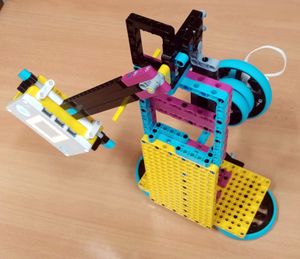
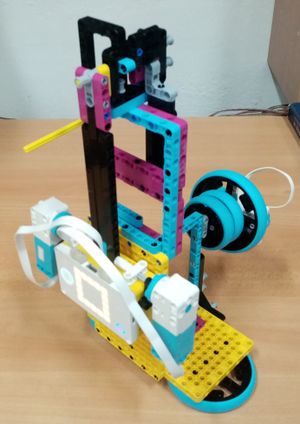
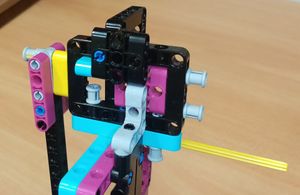
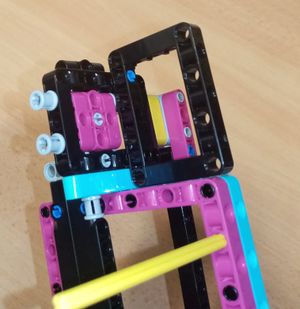
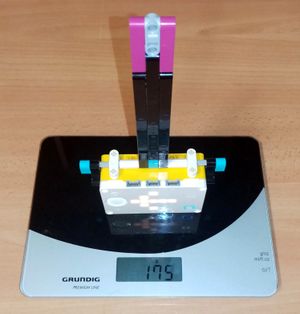
The model contains some parts from the extension set such as the large wheels. They are not essential, you can use your creativity and use other parts to raise the bottom of the model and to balance it with a weight on the back, if you only have the basic Spike Prime set.
Hint: if you do not have enough time to build this model, you can still perform the experiment: just attach the pendulum using a simple axle as shown in the last picture, it will work the same.
Pictures:
Building instructions:
Download building instructions:
Download stud.io model:
Program
Download: pendulum.llsp
The program gives the user a short time in the beginning to make sure that the pendulum is in a proper starting position. It visualizes this waiting stage on the display and with a sound. The pendulum should be started from the left side. The program then waits until it will swing to the right for the first time, and then it starts looking at the pitch value of the gyroscope, which oscillates between -90 and 90, and it is 0 when stopped and freely hanging. The program observes the changes of the pitch value and indicates the current direction of the swing on the display. At the same time, it is measuring the maximum angular displacement in both directions. It is also calculating the swing time of a complete cycle, a period. The maximum angular displacements and the periods are stored into the array so that they can later be processed on the computer - for instance visualized in a spreadsheet program.
Measure, analyze, think
Read the video description for details of our measurement!
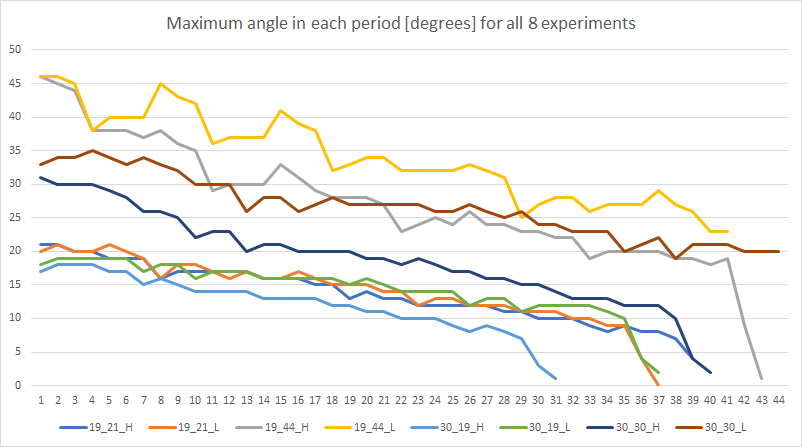
Example result of measurement (x: the number of oscillations, y: seconds (duration of 1 oscillation = period) in the first chart and maximum angle in degrees in each oscillation in the second chart)
Download: experiment.zip - recorded data from all 8 combinations as seen in video
- What can you see in the charts?
- How does changing of weight influences a) period, b) maximum angular displacement, and why?
- How does changing the starting angular displacement influences the period?
- How does changing the length of the pendulum influences and the period?
- Make your own measurements and recording.
- Experiment with other lengths, weights, starting positions.
- Extract the data from the measurements and create spreadsheet tables and charts.
- Discuss in your group what has happened.
How to export variables from your Spike Prime program?
Read the video description!
Explore and modify
- Modify the program so that it will measure and record the angular velocity during the swing. Measure the velocity for different starting conditions (length, weight, starting angle). Visualize it. Discuss what has happened.
- Modify the model so that ...
Present
- Prepare a short presentation for other groups. Tell others about how your measurement went, what issues did you have to solve. What do they mean and why did they happen?
Additional resources
- Download: Pendulum - all media files
