Difference between revisions of "Spike Prime - Mathematical Pendulum"
From RoboWiki
m |
|||
| Line 49: | Line 49: | ||
* Make your own recording | * Make your own recording | ||
| − | Example result of measurement: | + | Example result of measurement (x: the number of oscillations, y: seconds (duration of 1 oscillation = period) in the first chart and maximum angle in degrees in each oscillation in the second chart) |
[[Image:pendulum_periods_chart.png|periods for all 8 combinations]] | [[Image:pendulum_periods_chart.png|periods for all 8 combinations]] | ||
Revision as of 07:16, 23 February 2020
Let's begin
introduction...
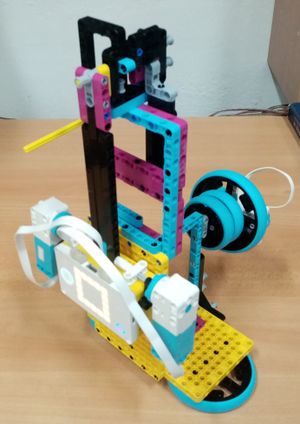
Build
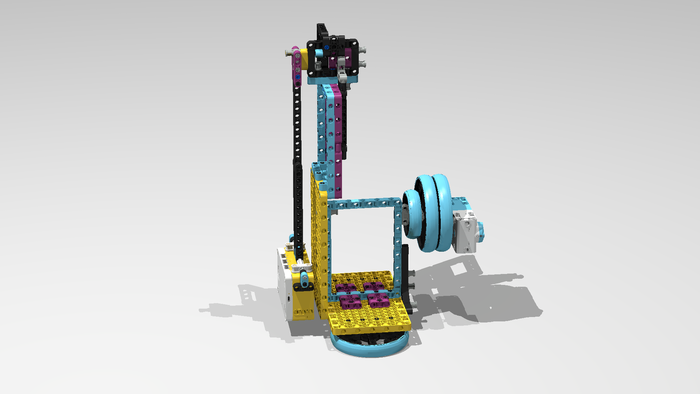
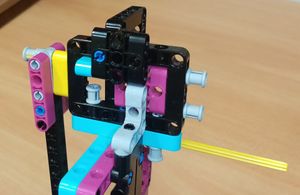
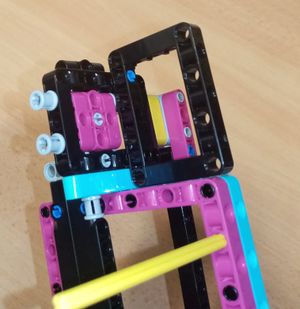
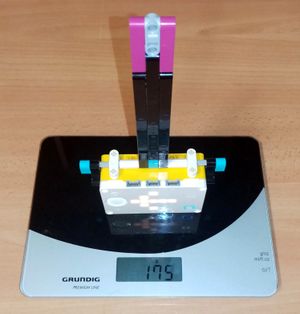
Model:
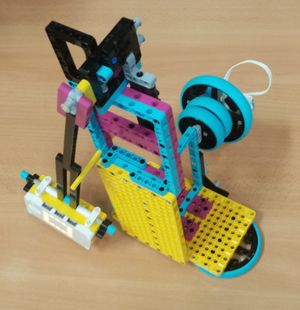
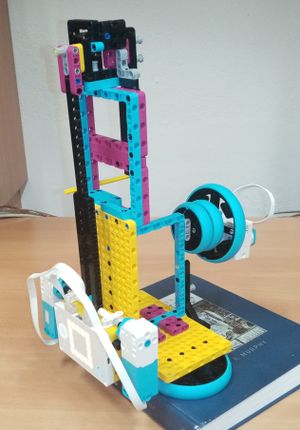
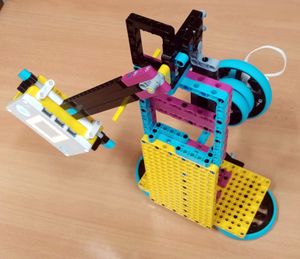
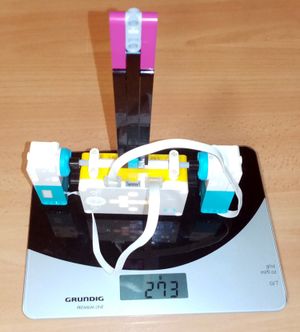
Pictures:
Building instructions:
Download building instructions:
Download stud.io model:
Program
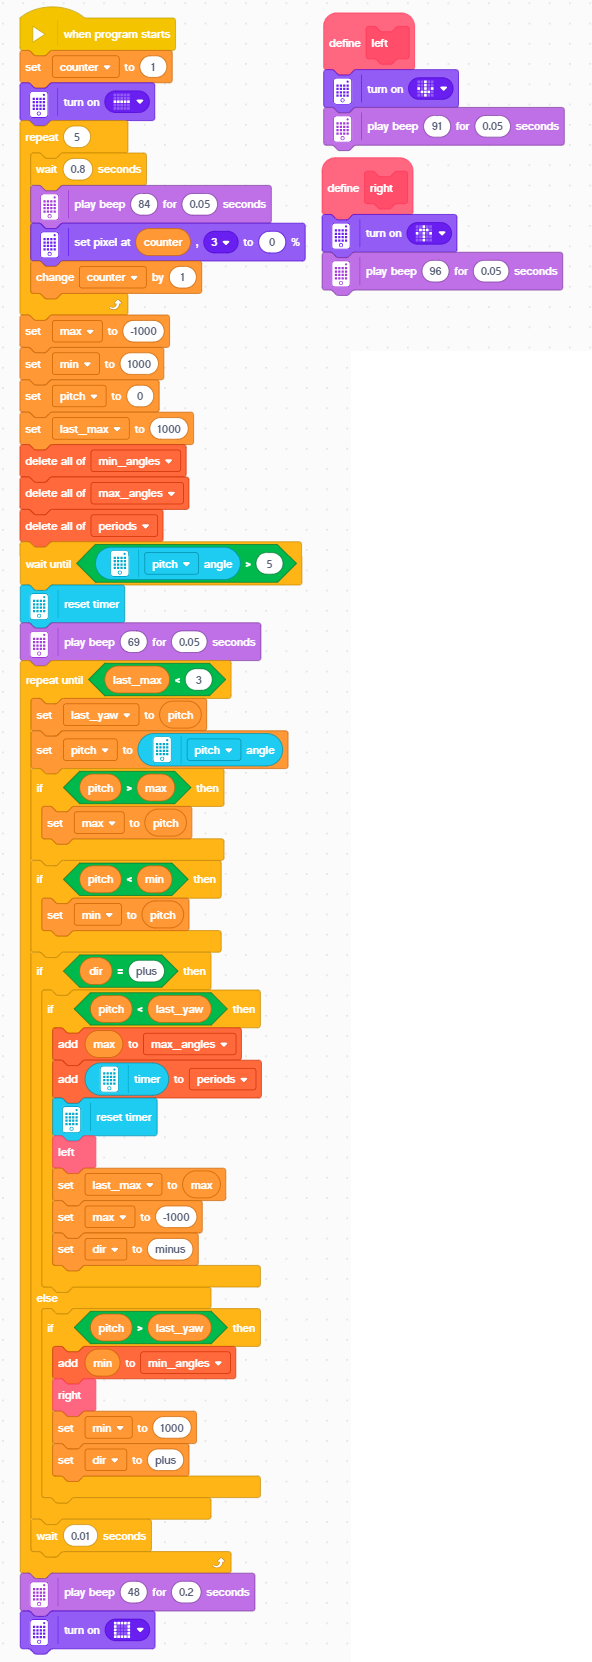
Download: pendulum.llsp
description of the program
Measure, analyze, think
- Make your own recording
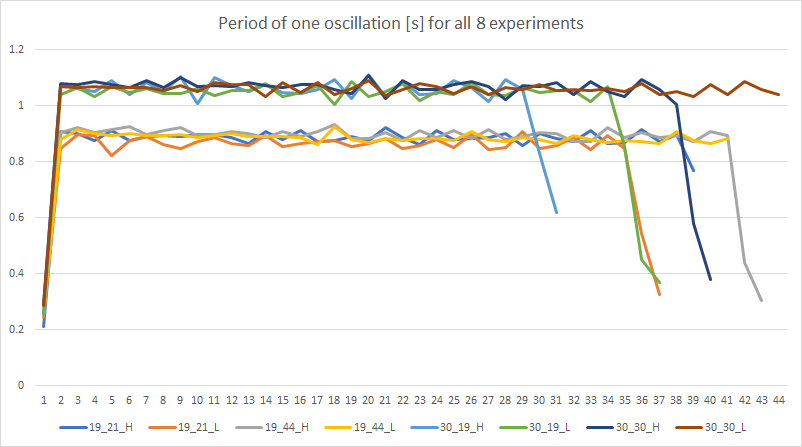
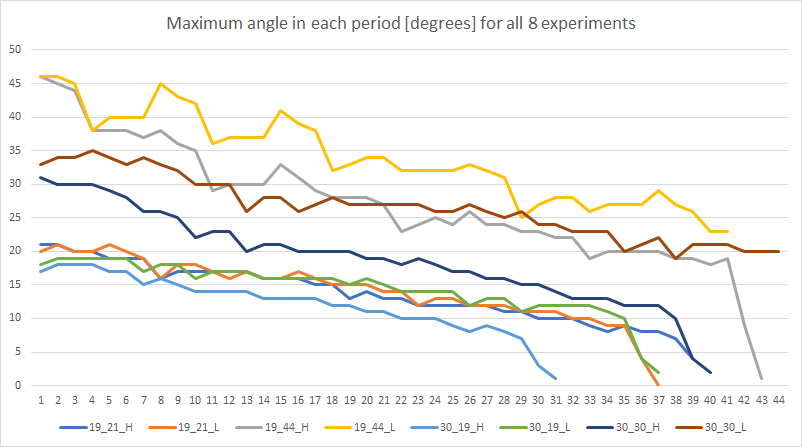
Example result of measurement (x: the number of oscillations, y: seconds (duration of 1 oscillation = period) in the first chart and maximum angle in degrees in each oscillation in the second chart)
Download: experiment.zip - recorded data from all 8 combinations as seen in video
- Perform measurements with your model and discuss in your group what has happened.
- How to export variables from your Spike Prime program?
Explore and modify
- Modify the program so that ...
- Modify the model so that ...
Present
- Prepare a short presentation for other groups. Tell others about how your measurement went, what issues did you have to solve. What do they mean and why did they happen?
Additional resources
- Download: Pendulum - all media files
