LunarLander (Deep) Q-learning - Filip Pavlove
Contents
Goal
The main goal of this project is the usage of reinforcement algorithms for control of lunar lander. (see https://gym.openai.com/envs/LunarLander-v2/)
The landing pad is always at coordinates (0,0). Coordinates are the first two numbers in the state vector. The reward for moving from the top of the screen to landing pad and zero speed is about 100..140 points. If lander moves away from landing pad it loses reward back. Episode finishes if the lander crashes or comes to rest, receiving additional -100 or +100 points. Each leg ground contact is +10. Firing main engine is -0.3 points each frame. Solved is 200 points. Landing outside landing pad is possible. Fuel is infinite, so an agent can learn to fly and then land on its first attempt. Four discrete actions available: do nothing, fire left orientation engine, fire main engine, fire right orientation engine.
Methodology
 Q-learning: https://link.springer.com/article/10.1007/BF00992698
 Deep Q-learning: https://www.cs.toronto.edu/~vmnih/docs/dqn.pdf
Implementation of both algorithms is in Python. The neural network model is implemented in PyTorch framework.
Q-learning
The state-space of the lander consists of six continuous variables (x-position, y-position, x-velocity, y-velocity, angle, angular-velocity), and two boolean values (left-leg and right-leg contact with the ground).
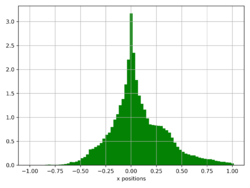
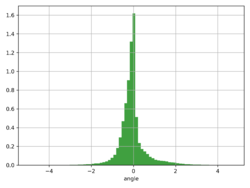
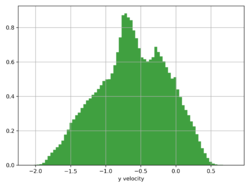
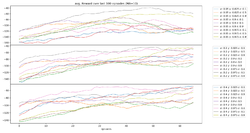
Continuous states of the agent were discretized into several "buckets". Each value of q-table represents the maximum expected future rewards for each action at each state. The total amount of (state, action) pairs in the lunars q-table is 12*10*5*5*6*5*2*2*4=1440000. Bounds of states were derived from the distributions of the observed values (here images from left). Hyper-parameters were chosen experimentally (fourth image):
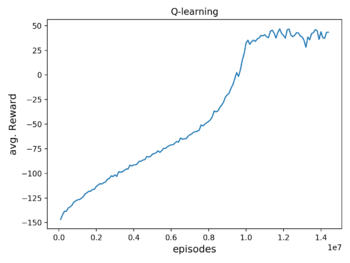
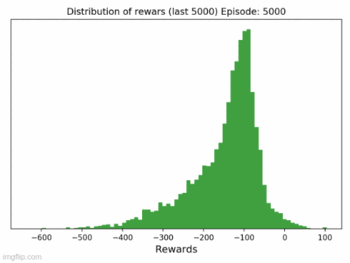
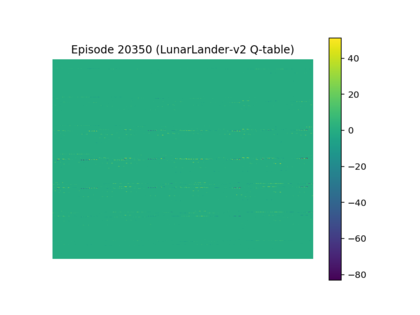
The average reward of agent trained on over 1400000 episodes is around 40 (first image from left). The presented gif animation highlights the distribution of rewards over the training time (click on the second image). It seems that it should get better if the training time was prolonged, but it doesn't. The third image from the left represents (state, action) values of q-table. This visualization shows the most obvious drawback of "vanilla" q-learning, which is the high sparsity (a lot of zeros), and high dimensionality of the q-table (zoom in).
Deep Q-learning
Architecture & hyper-paramters
Architecture: input layer (8) -> hidden layer (64) -> hidden layer (64 units) -> output layer (4), with ReLu activations.
Loss: SmoothL1Loss, Optimizer: Adam, Replay memory size: 10000, Gamma(discount factor): 0.99, Mini-batch size: 128, Episode: 875.
Although, the network was pre-trained with high epsilon (lots of random actions were taken - exploration).
Training
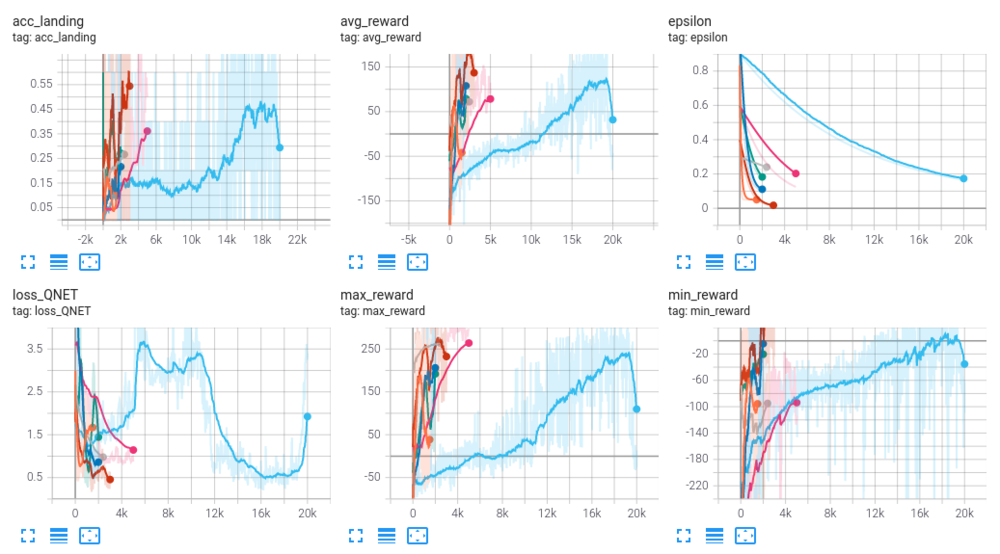
Presented parameters and hyper-parameters were chosen experimentally. Monitored metrics of experiments, are presented in the snapshot of Tensorboard):
Results
Performance of models is based on 2 metrics that are computed over 10000 episodes.
1. Correct landing: landing of the rover is considered correct if both legs are in contact with the ground inside of the landing pad.
2. Average reward: self-explenatory.
